Sources and method
How this was built
A directory is only worth the sourcing behind it. Here is where the entries come from, what the labels mean, what is deliberately left out, and how to tell us we got something wrong.
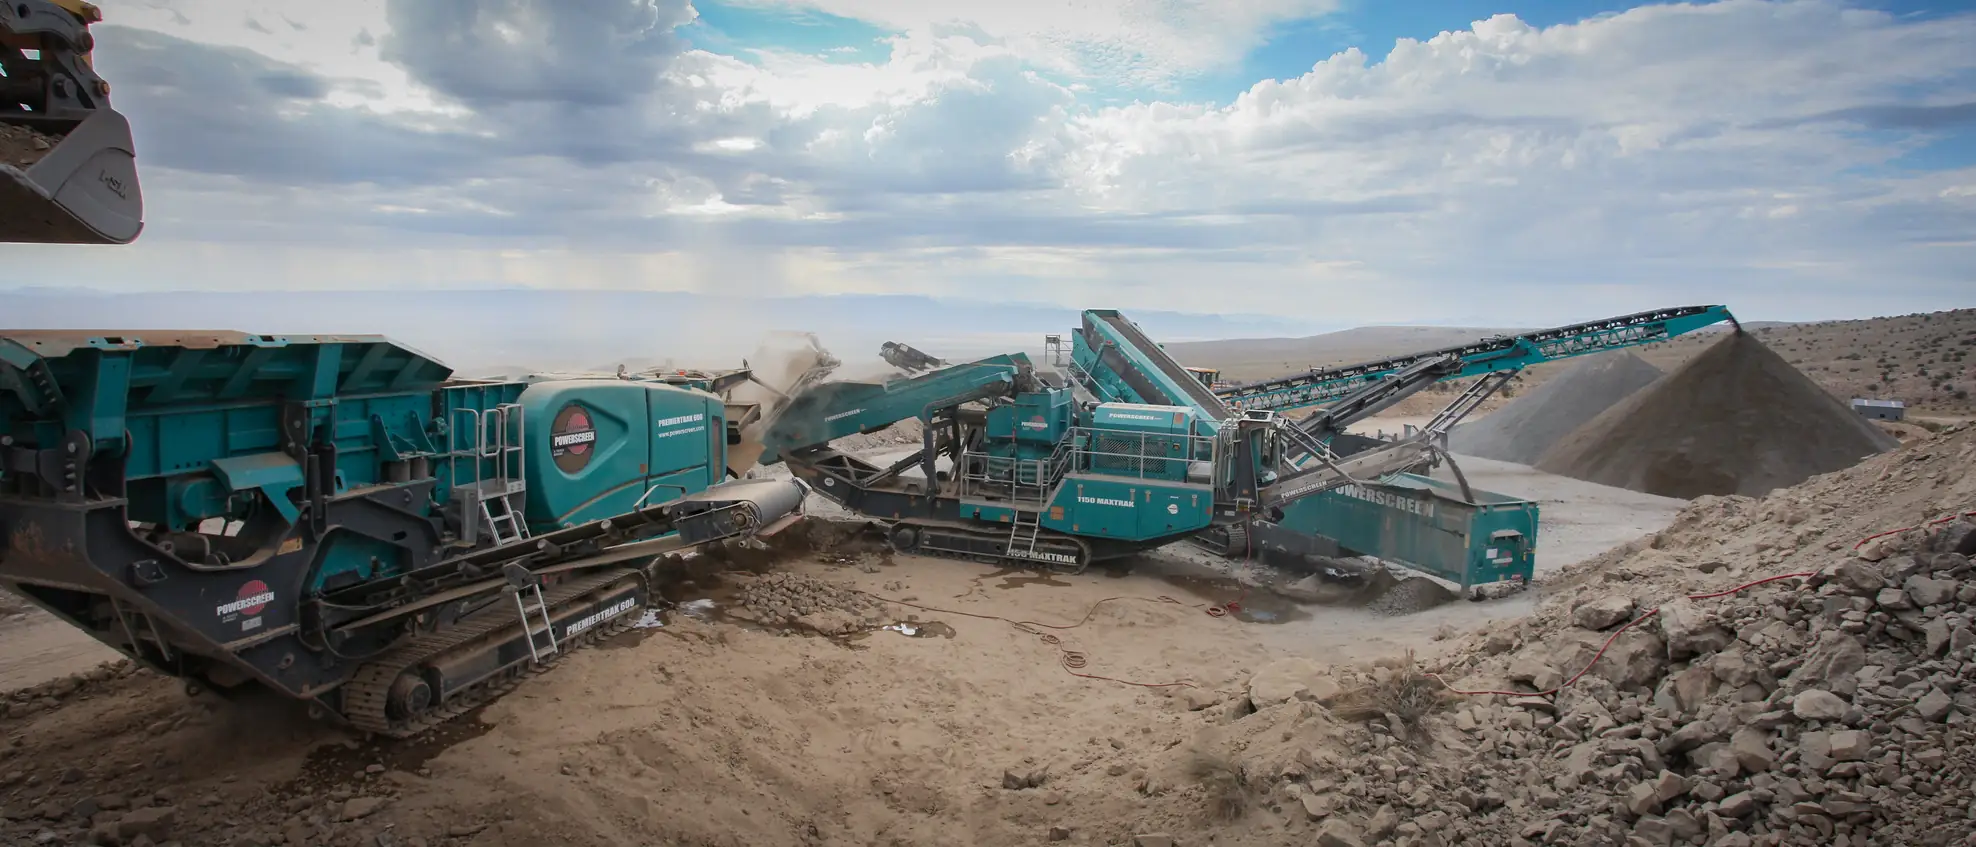
Primary crusher and conveyor gallery
Where the directory comes from
Entries are built from USGS Mineral Commodity Summaries and Minerals Yearbook chapters, state geological surveys, BLM and EPA records, operator filings and investor disclosures, and trade press. Each entry carries its own source links; follow them rather than trusting the summary.
What the status labels mean
- Active — producing or operating as of the most recent source.
- Under construction — funded and being built; not producing.
- Development / permitting — a project, not a mine. No output.
- Care & maintenance — idled but maintained, restartable.
- Idle / historic — shut, listed because the capacity existed.
What this list is not
It is not exhaustive. There are thousands of active mineral operations in the United States, most of them sand, gravel, crushed stone and cement. This directory covers the metal and industrial mineral operations that feed manufacturing, and it will keep growing.
Found an error?
Production figures move, operators change hands, and plants restart. If an entry is wrong or out of date, send the correction with a source and it gets fixed.
listings@mineamericagreatagain.com
Claims we checked and rejected
Advocacy for domestic mining is full of figures that fall apart when a procurement officer or a journalist checks them. Each of these is common, and each one is wrong or badly overstated. None of them appear anywhere on this site.
- “It takes 29 years to permit a mine.” That figure measures discovery to production. Permitting is an estimated 2–10 years of it; median mining EIS completion 2010–2018 was four years. The US sample in that study was 13 mines, only three of them operating.
- “Only the US is this slow.” Canada came in at 27 years against the US at 28.9 in the same study. Australia at 20 is the fair comparator.
- “The US is 100% import-reliant on rare earths.” It is 67%. The accurate and still-strong claim is about separation and magnet capacity, not mining.
- “US lithium is shipped to China and comes back.” US lithium imports are 54% Chile and 43% Argentina. Real dependency, wrong story.
- “A 30% gallium disruption would cost $602 billion.” Internally inconsistent. USGS peer-modelled a total gallium-and-germanium ban at $3.4 billion.
- “There were 15 copper smelters in 1980.” Unverifiable against a primary document. Seven in 1996 down to two in 2025 is sourced, and nearly as stark.
Primary references
- USGS Mineral Commodity Summaries 2026
- USGS Fact Sheet 2025-3038 — mining vs. processing shares
- IEA Global Critical Minerals Outlook 2025
- S&P Global World Exploration Trends 2026
- Major Mines of Nevada 2024
- Columbia SIPA on US copper smelting
- RFF, Onshoring the Mineral Supply Chain
- Breakthrough Institute on permitting